
Table of Contents
- Why Survey Methodology Matters More Than the Data Itself
- Choosing a Survey Topic That Earns Coverage
- Sample Size: How Many Respondents You Actually Need
- How To Write Survey Questions That Produce Clean, Publishable Data
- Statistical Testing: The Credibility Layer Most Surveys Are Missing
- From Survey Data to Earned Media Coverage
- Survey Credibility Checklist
- Build Trust Through Better Research
- Frequently Asked Questions
Surveys are one of the most powerful tools in content marketing. A well-designed survey produces original data that journalists want to cover, that earns high-authority backlinks, and that positions your brand as a credible source in your industry.
But most content marketing surveys don’t earn media coverage. They get ignored, and the reason usually isn’t the topic. It’s the methodology.
Over half of journalists say they want original data included with pitches. That makes survey data the second most requested pitch element behind interview access. Journalists don’t just want data, though. They want data they can trust. They’ll check your sample size, question design, and statistical rigor before deciding whether your findings are worth covering.
In this article, I’ll tell you how to design content marketing surveys that meet those standards: choosing topics that earn coverage, calculating the right sample size, writing unbiased questions, running statistical tests, and packaging results for media outlets.
Why Survey Methodology Matters More Than the Data Itself
Journalists evaluate your survey’s credibility before they evaluate its findings. A surprising stat means nothing if the methodology behind it is questionable. In a media landscape where 36% of journalists cite disinformation as their most pressing challenge, data quality is the first filter every editor applies.
What Journalists Look for Before They Cover Survey Data
Before a journalist writes a single word about your survey, they’re checking for red flags. Here’s what they evaluate:
- Sample size. Is it large enough to draw meaningful conclusions? A survey of 200 people won’t cut it for national claims.
- Methodology transparency. Did you explain how respondents were recruited, when the survey was fielded, and what platform you used?
- Question neutrality. Do the questions lead respondents toward a particular answer, or are they genuinely open?
- Statistical testing. Did you test whether your findings are statistically significant, or are you reporting raw percentages without context?
- Source credibility. Is a reputable research panel behind the data, or did you poll your own email list and call it representative?
Eighty-four percent of journalists say stories often start with PR pitches, but 86% ignore pitches that miss the mark. Rigorous methodology is what separates a pitch that earns coverage from one that gets deleted. Our survey of 500+ journalists on pitching preferences confirmed this pattern: credibility and relevance are the two factors that determine whether your pitch gets opened or trashed.
The Cost of Getting It Wrong
A poorly designed survey doesn’t just fail to earn media. It actively damages your brand’s reputation. Journalists talk to each other. If your data gets called out for a flawed sample or leading questions, that reputation follows your next campaign.
There’s also the resource cost. Survey-based content marketing campaigns require significant content production investment: research design, panel fees, data analysis, visualization, and outreach. Cutting corners on methodology means wasting that entire budget on data no one will publish. You’re better off spending more on the survey itself and less on the number of campaigns you run in a given year.
Choosing a Survey Topic That Earns Coverage
No amount of methodological rigor saves a survey on a topic journalists don’t care about. Topic selection is where your content marketing strategy meets editorial judgment.
Aligning Survey Topics With Journalist Interest and Search Intent
The strongest survey topics sit at the intersection of three things: what your target audience cares about, what journalists are actively covering, and what people search for online.
Start with search data. What questions does your audience ask? What are the pain points they’re trying to solve? Then layer in editorial timing: Is there a news cycle, policy change, or cultural moment that makes this topic urgent?
“State of the industry” surveys tend to earn the broadest coverage because they give journalists a snapshot of where things stand right now. Consumer sentiment surveys on emerging issues (AI adoption, financial stress, health care access) work well for the same reason. They give reporters something to react to.
Your content marketing plan should treat survey topics as strategic assets in the customer journey, not one-off ideas.
The best topics are ones you can revisit annually, building a longitudinal dataset that becomes more valuable (and more linkable) over time.
Data journalism campaigns built on recurring research consistently outperform one-off studies in both media pickup and long-term SEO value.
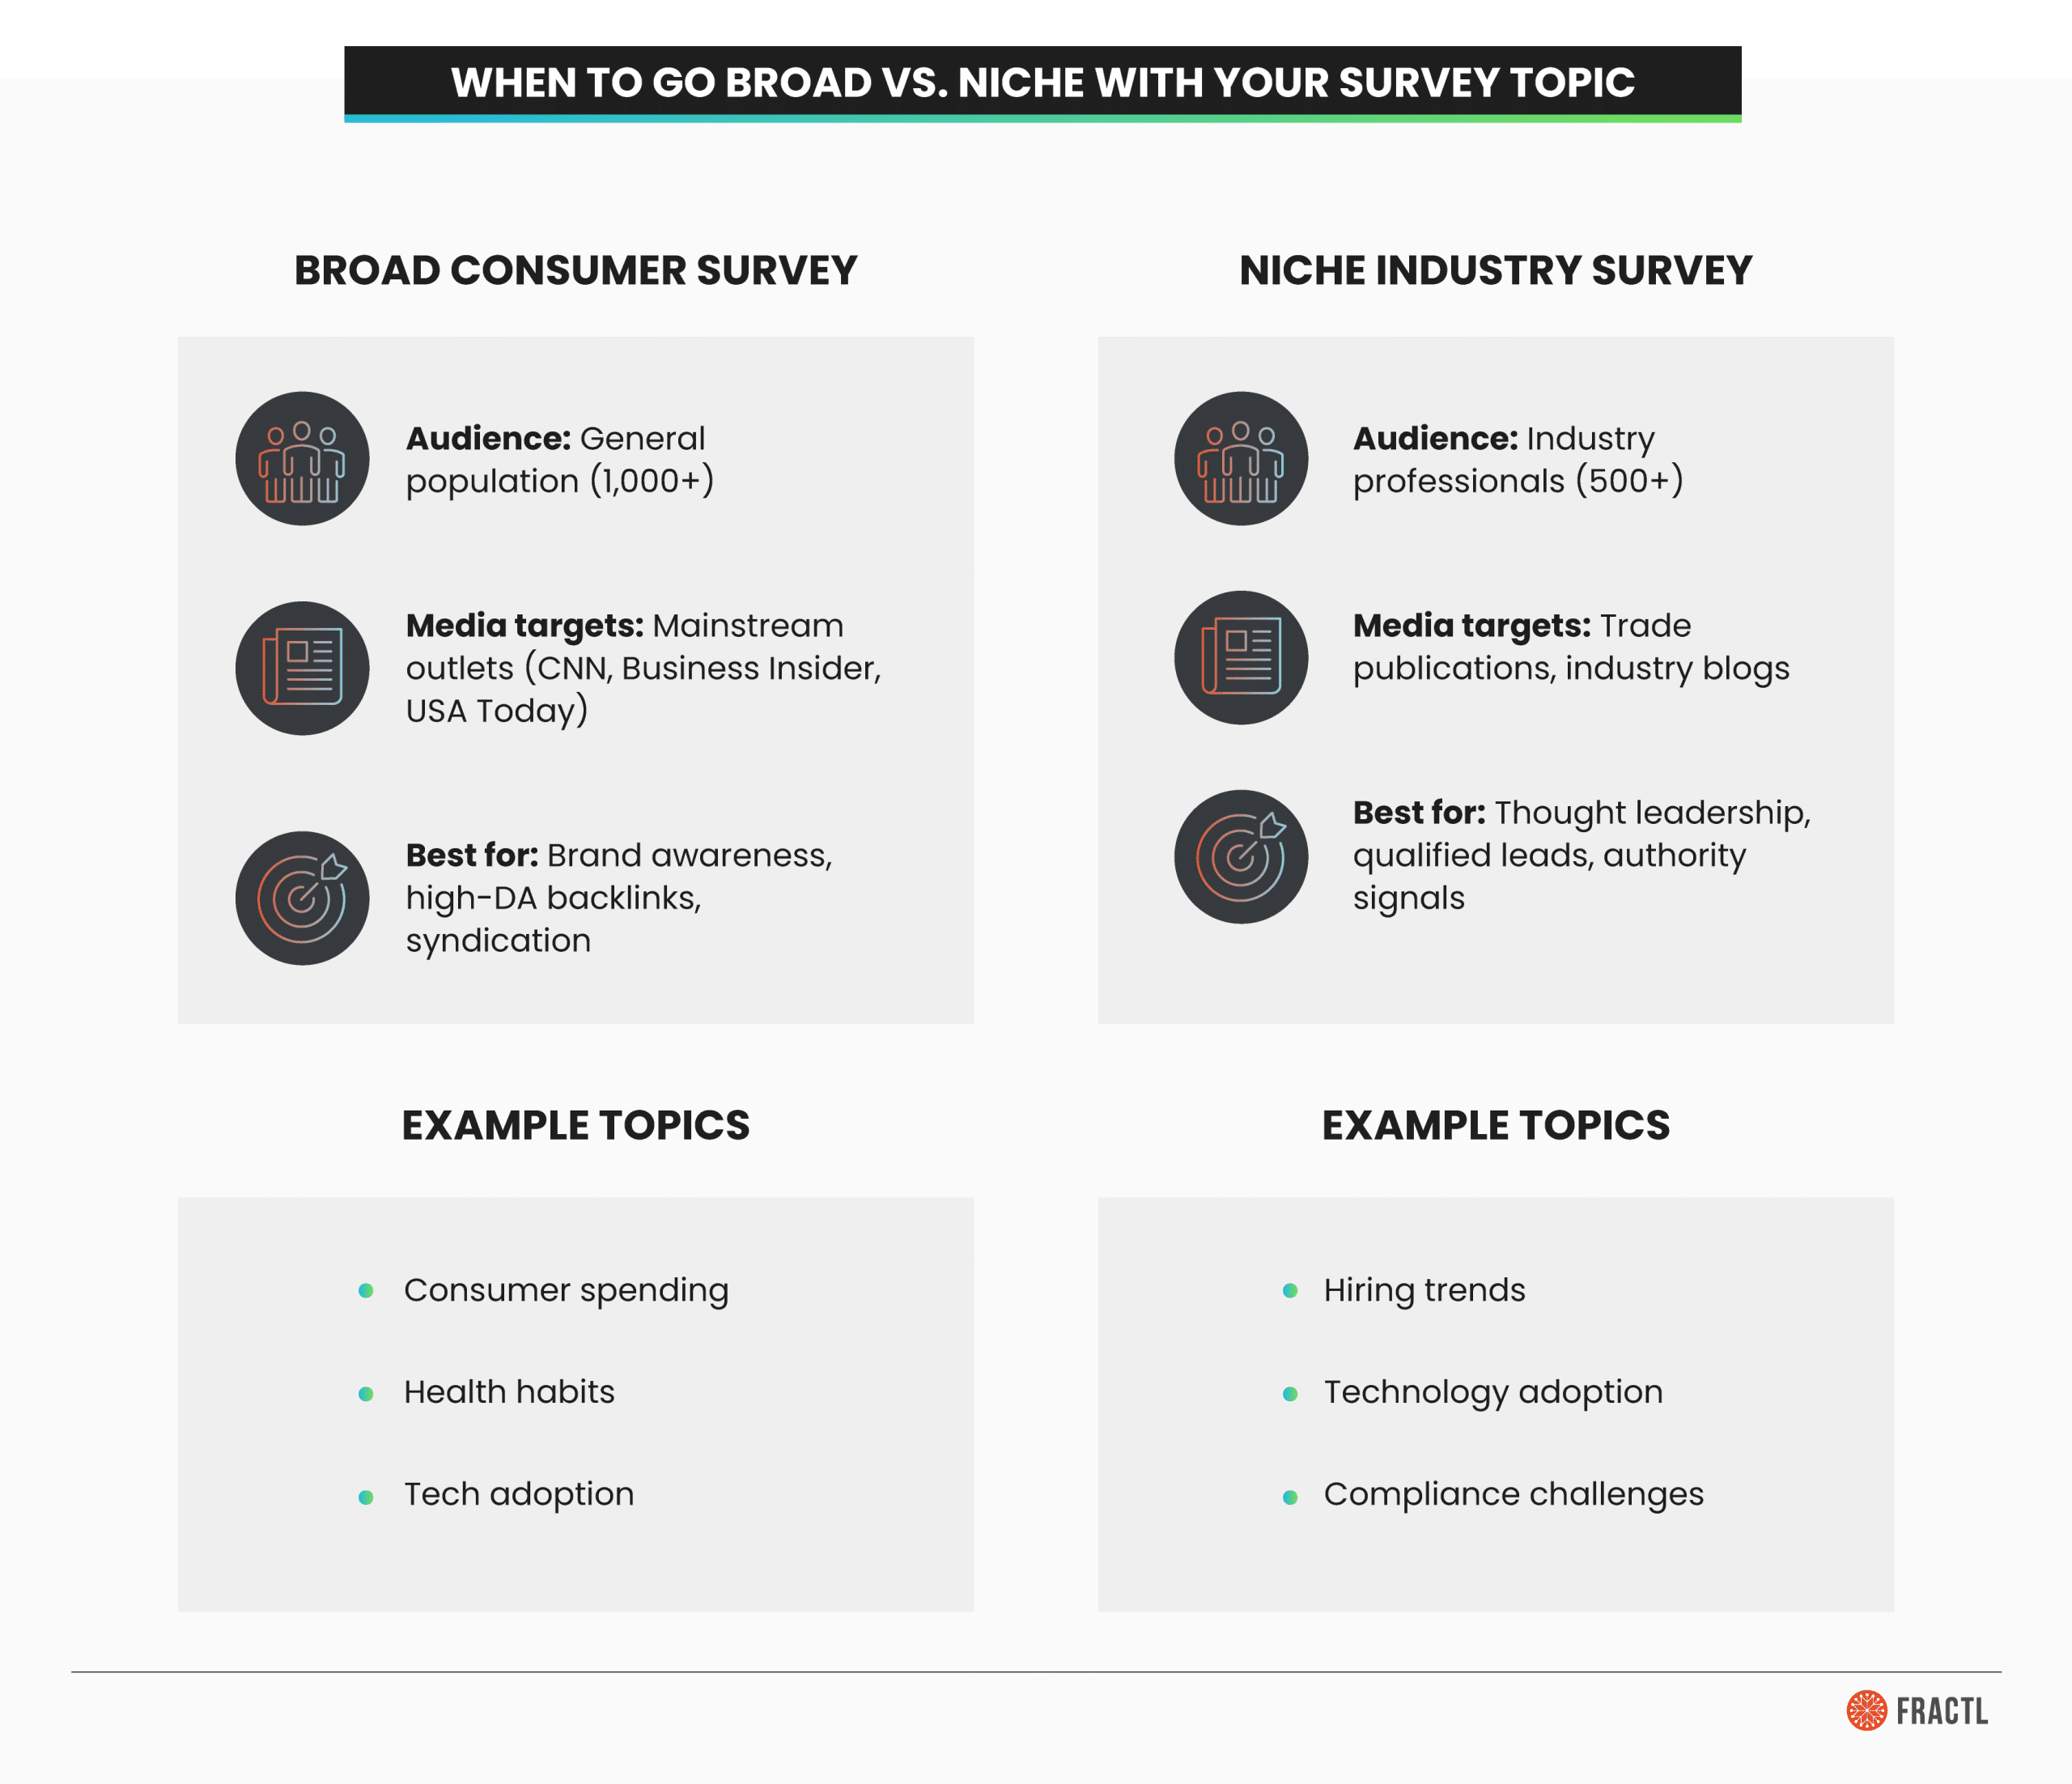
Broad Appeal vs. Niche Depth
Broad consumer surveys earn placements in mainstream media outlets. A survey of 1,000+ Americans on financial habits could land in Business Insider, CNBC, or USA Today. These campaigns drive brand awareness and high-quality backlinks at scale.
Niche industry surveys earn coverage in trade publications and build thought leadership within a specific vertical. A survey of 500 HR directors on hiring practices may not go viral, but it positions your brand as a thought leader with potential customers who actually buy your product.
Both have a place in an effective content marketing strategy. The key is matching the survey scope to your business goals and understanding which type of earned media each produces.
Sample Size: How Many Respondents You Actually Need
This is the question I get asked most often, and the answer involves math that most content marketers skip over.
The Formula Behind Credible Sample Sizes
The standard formula for calculating sample size comes from William G. Cochran’s Sampling Techniques, first published in 1963 and now in its third edition. It’s the foundation of modern survey methodology and market research, and the formula most researchers use:
n₀ = Z² × p(1−p) / e²
Here’s what each variable means:
- Z is the z-score for your desired confidence level (1.96 for 95% confidence, 2.576 for 99%)
- p is the expected proportion of the attribute you’re measuring (use 0.5 if you’re unsure, which gives the most conservative estimate)
- e is your desired margin of error (0.05 for ±5%, 0.03 for ±3%)
At 95% confidence with ±5% margin of error and maximum variability, the formula produces a minimum of 384 respondents. But for content marketing surveys that need to earn media coverage, that floor is too low.
| Confidence level | Margin of error | Minimum sample size |
|---|---|---|
| 95% | ±5% | 384 |
| 95% | ±3% | 1,068 |
| 99% | ±5% | 666 |
| 99% | ±3% | 1,849 |
Why 1,000+ Respondents Is the Content Marketing Standard
Most credible content marketing surveys aim for 1,000 or more respondents. At that threshold, you’re looking at approximately ±3% margin of error at 95% confidence for any population above 10,000, which is the level of precision journalists and editors recognize as reliable.
There’s a practical reason, too:
Larger sample sizes let you run meaningful demographic cross-tabulations (breakdowns by age, gender, region, income) without losing statistical power in subgroups.
If you’re surveying 500 people total, your “Gen Z respondents” subgroup might only be 60 people, which isn’t enough to make claims about. At 1,000+, your subgroups are large enough to analyze independently.
The survey tools and survey platform you choose affect this as well. Paid research panels (like Prolific, Cint, or Dynata) let you target specific demographics and hit sample size targets quickly. Free survey distribution through social media or email lists can work for niche audiences, but you’ll need to account for self-selection bias in your data collection approach.
How To Write Survey Questions That Produce Clean, Publishable Data
Question design is where surveys succeed or fail. A biased question produces biased data regardless of your sample size. And journalists can spot loaded questions from the subject line of your pitch.
Use The Right Question Types
Different question types serve different analytical purposes. Here’s when to use each in a content marketing survey:
- Multiple choice (forced-answer). Best for producing clean, comparable data. Pew Research Center found that forced-answer questions produce more reliable data than select-all-that-apply formats because they require respondents to evaluate each option individually.
- Rating scales. Useful for measuring intensity of opinion (1 to 5, strongly disagree to strongly agree). These produce data that works well in visualizations and cross-tabulations.
- Ranking questions. Good for priority data (“rank these five factors from most to least important”). These create clear hierarchies that make for strong headlines.
- Open-ended questions. Use sparingly. They produce qualitative color (great for pull quotes in press materials) but are harder to analyze at scale. One or two per survey is usually enough.
- Select-all-that-apply. Use with caution. While they feel easier for respondents, they produce less precise data because respondents often satisfice (select the first few options that seem right and stop reading).
Avoid Leading Questions and Response Bias
A leading question pushes respondents toward a particular answer. Here’s the difference:
| Leading: “Don’t you agree that companies should invest more in employee wellness programs?” | Neutral: “How important do you think it is for companies to invest in employee wellness programs?” |
The first version signals the “right” answer. The second lets respondents decide for themselves. Response bias also shows up in unbalanced answer options (three positive choices and one negative), loaded language (“wasteful government spending” vs. “government expenditure”), and double-barreled questions that ask two things at once.
Social desirability bias is another factor. Respondents tend to answer how they think they should answer, not how they actually feel. Anonymous survey design helps, and so does indirect question framing (“How do people you know feel about X?” rather than “How do you feel about X?”). Customer feedback surveys often suffer from this bias when respondents feel their answers aren’t truly anonymous.
Structure Surveys for Completion and Quality
Survey length directly affects data quality. Aim for four to six minutes of completion time. Longer questionnaires produce higher dropout rates and lower-quality survey responses from fatigued respondents who start clicking randomly to finish.
A few structural best practices are:
- Order questions from general to specific. Start with broad, easy questions to build momentum before asking anything sensitive or complex.
- Include attention checks. A simple question like “Please select ‘strongly agree’ for this question” catches respondents who aren’t reading. Disqualify them from your dataset.
- Add screening questions. If you need respondents with specific characteristics (homeowners, parents, business owners), filter them at the start so you don’t waste panel spend on unqualified responses.
- Optimize for mobile. A significant portion of respondents complete surveys on a mobile device. Make sure your survey platform renders cleanly on smaller screens with easy-to-tap response options.
Statistical Testing: The Credibility Layer Most Surveys Are Missing
Most content marketing surveys stop at raw percentages. “Sixty-three percent of respondents said X.” That’s a finding, but it’s not a tested one. Statistical testing is what separates data journalists’ trust from data they question, and it’s the single biggest gap in how most brands approach survey-based content.
What Statistical Significance Means (and Why Journalists Care)
Statistical significance means the difference you’re reporting is unlikely to have occurred by chance.
The industry standard threshold is p < 0.05: Less than a 5% probability that the result is random noise.
Here’s what that looks like in practice: If your survey finds that 72% of millennials prefer remote work compared to 58% of baby boomers, a significance test tells you whether that 14-point gap is real or just sampling variability. Without the test, you’re guessing.
Confidence intervals serve a similar function. Instead of reporting “63% of respondents prefer X,” you can report “63% ±3% at 95% confidence,” meaning the true population value likely falls between 60% and 66%. That level of precision is what editors want to see before they assign a reporter to your story.
Including significance testing in your methodology section signals to journalists that your data meets both academic and journalistic standards.
It’s a trust signal that most competing surveys don’t provide, which gives your pitch an immediate credibility advantage. You can track these metrics alongside your standard marketing KPIs to measure how methodology rigor correlates with campaign performance.
Cross-Tabulation and Subgroup Analysis
The most newsworthy findings in any survey usually come from cross-tabulations: analyzing results broken down by demographic subgroups like age, gender, income, and region.
| Decent headline: “Americans support policy X” is a decent headline. | Better headline: “Gen Z supports policy X at twice the rate of boomers” |
Those subgroup differences are where journalists find their angle, and they’re what make your data shareable on social media platforms like LinkedIn and TikTok.
There’s a critical caveat, though. Your subgroup sample sizes need to be large enough for statistical validity. A good rule of thumb:
Aim for at least 100 respondents per subgroup you plan to report on.
If you want to cross-tabulate by generation, gender, and region, you need a total sample size large enough that each cell has meaningful data behind it.
This is another reason 1,000+ respondents matter. It’s not just about the overall margin of error; it’s about having enough data in the subgroups where the real stories live.
Presenting Your Methodology Transparently
A publishable methodology section should include:
- Sample size and how it was calculated
- Collection dates (when the survey was fielded)
- Survey platform used (e.g., Prolific, Qualtrics, SurveyMonkey)
- Respondent sourcing method (paid panel, email list, social media recruitment)
- Confidence level and margin of error
- Any weighting applied to match census demographics
- Screening criteria used to qualify respondents
Transparency is itself a trust signal. Journalists are more likely to cover data when they can verify how it was collected. This section also protects you editorially; if anyone questions your findings, you have a defensible methodology on record.
From Survey Data to Earned Media Coverage
Once your data is collected and analyzed, the next step is packaging it for journalists and distributing it through the right marketing channels. This is where a strong digital PR strategy turns research into results.
Packaging Survey Findings for Journalists
Sixty-two percent of journalists are now handling responsibilities beyond their core reporting roles.
They don’t have time to dig through a raw dataset. You need to do that work for them. Here’s what a journalist-ready survey package includes:
- A landing page with full methodology. This is where you host the complete findings, methodology section, and data visualizations. It’s the URL you’ll include in every pitch.
- Data visualizations and infographics. Charts, graphs, and social media-ready graphics that journalists can embed or screenshot. Make them clean, labeled, and easy to read at reduced sizes.
- Press release with the top three to five findings. Lead with the most surprising stat. Include pull quotes and methodology summary.
- Short-form social media content. Individual data points formatted for LinkedIn, TikTok, and other social media platforms where your audience spends time.
- Long-form editorial content. Blog content, white papers, or case studies that contextualize the findings for your target audience.
- Video content. Short video breakdowns of key findings perform well on social media and can be repurposed for webinars, podcasts, and email newsletters.
Pitching Survey-Based Content to Media Outlets
The pitch is where methodology pays off.
Sixty-two percent of journalists want personalized email pitches, and survey-based campaigns give you a natural personalization hook: the data itself.
I’ve written about how research-backed content earns media attention at scale when the methodology is sound and the findings genuinely surprise.
- Lead with the most surprising finding in your subject line. Don’t bury it. A subject line like “New survey: 72% of Gen Z workers would take a pay cut for remote work” immediately tells the journalist what the story is and why their readers would care.
- Include methodology details early in the pitch body. Sample size, confidence level, and collection dates preempt the credibility questions that would otherwise slow down the editorial process.
- Offer exclusive angles to tier-one publications. Let them break a specific finding before you distribute the full dataset.
- Personalize by beat. A personal finance reporter cares about the income cross-tabulations. A workplace reporter cares about the generational breakdowns. Same dataset, different angle, different pitch.
Our research on email pitch subject lines shows that specificity in the subject line dramatically improves open rates.
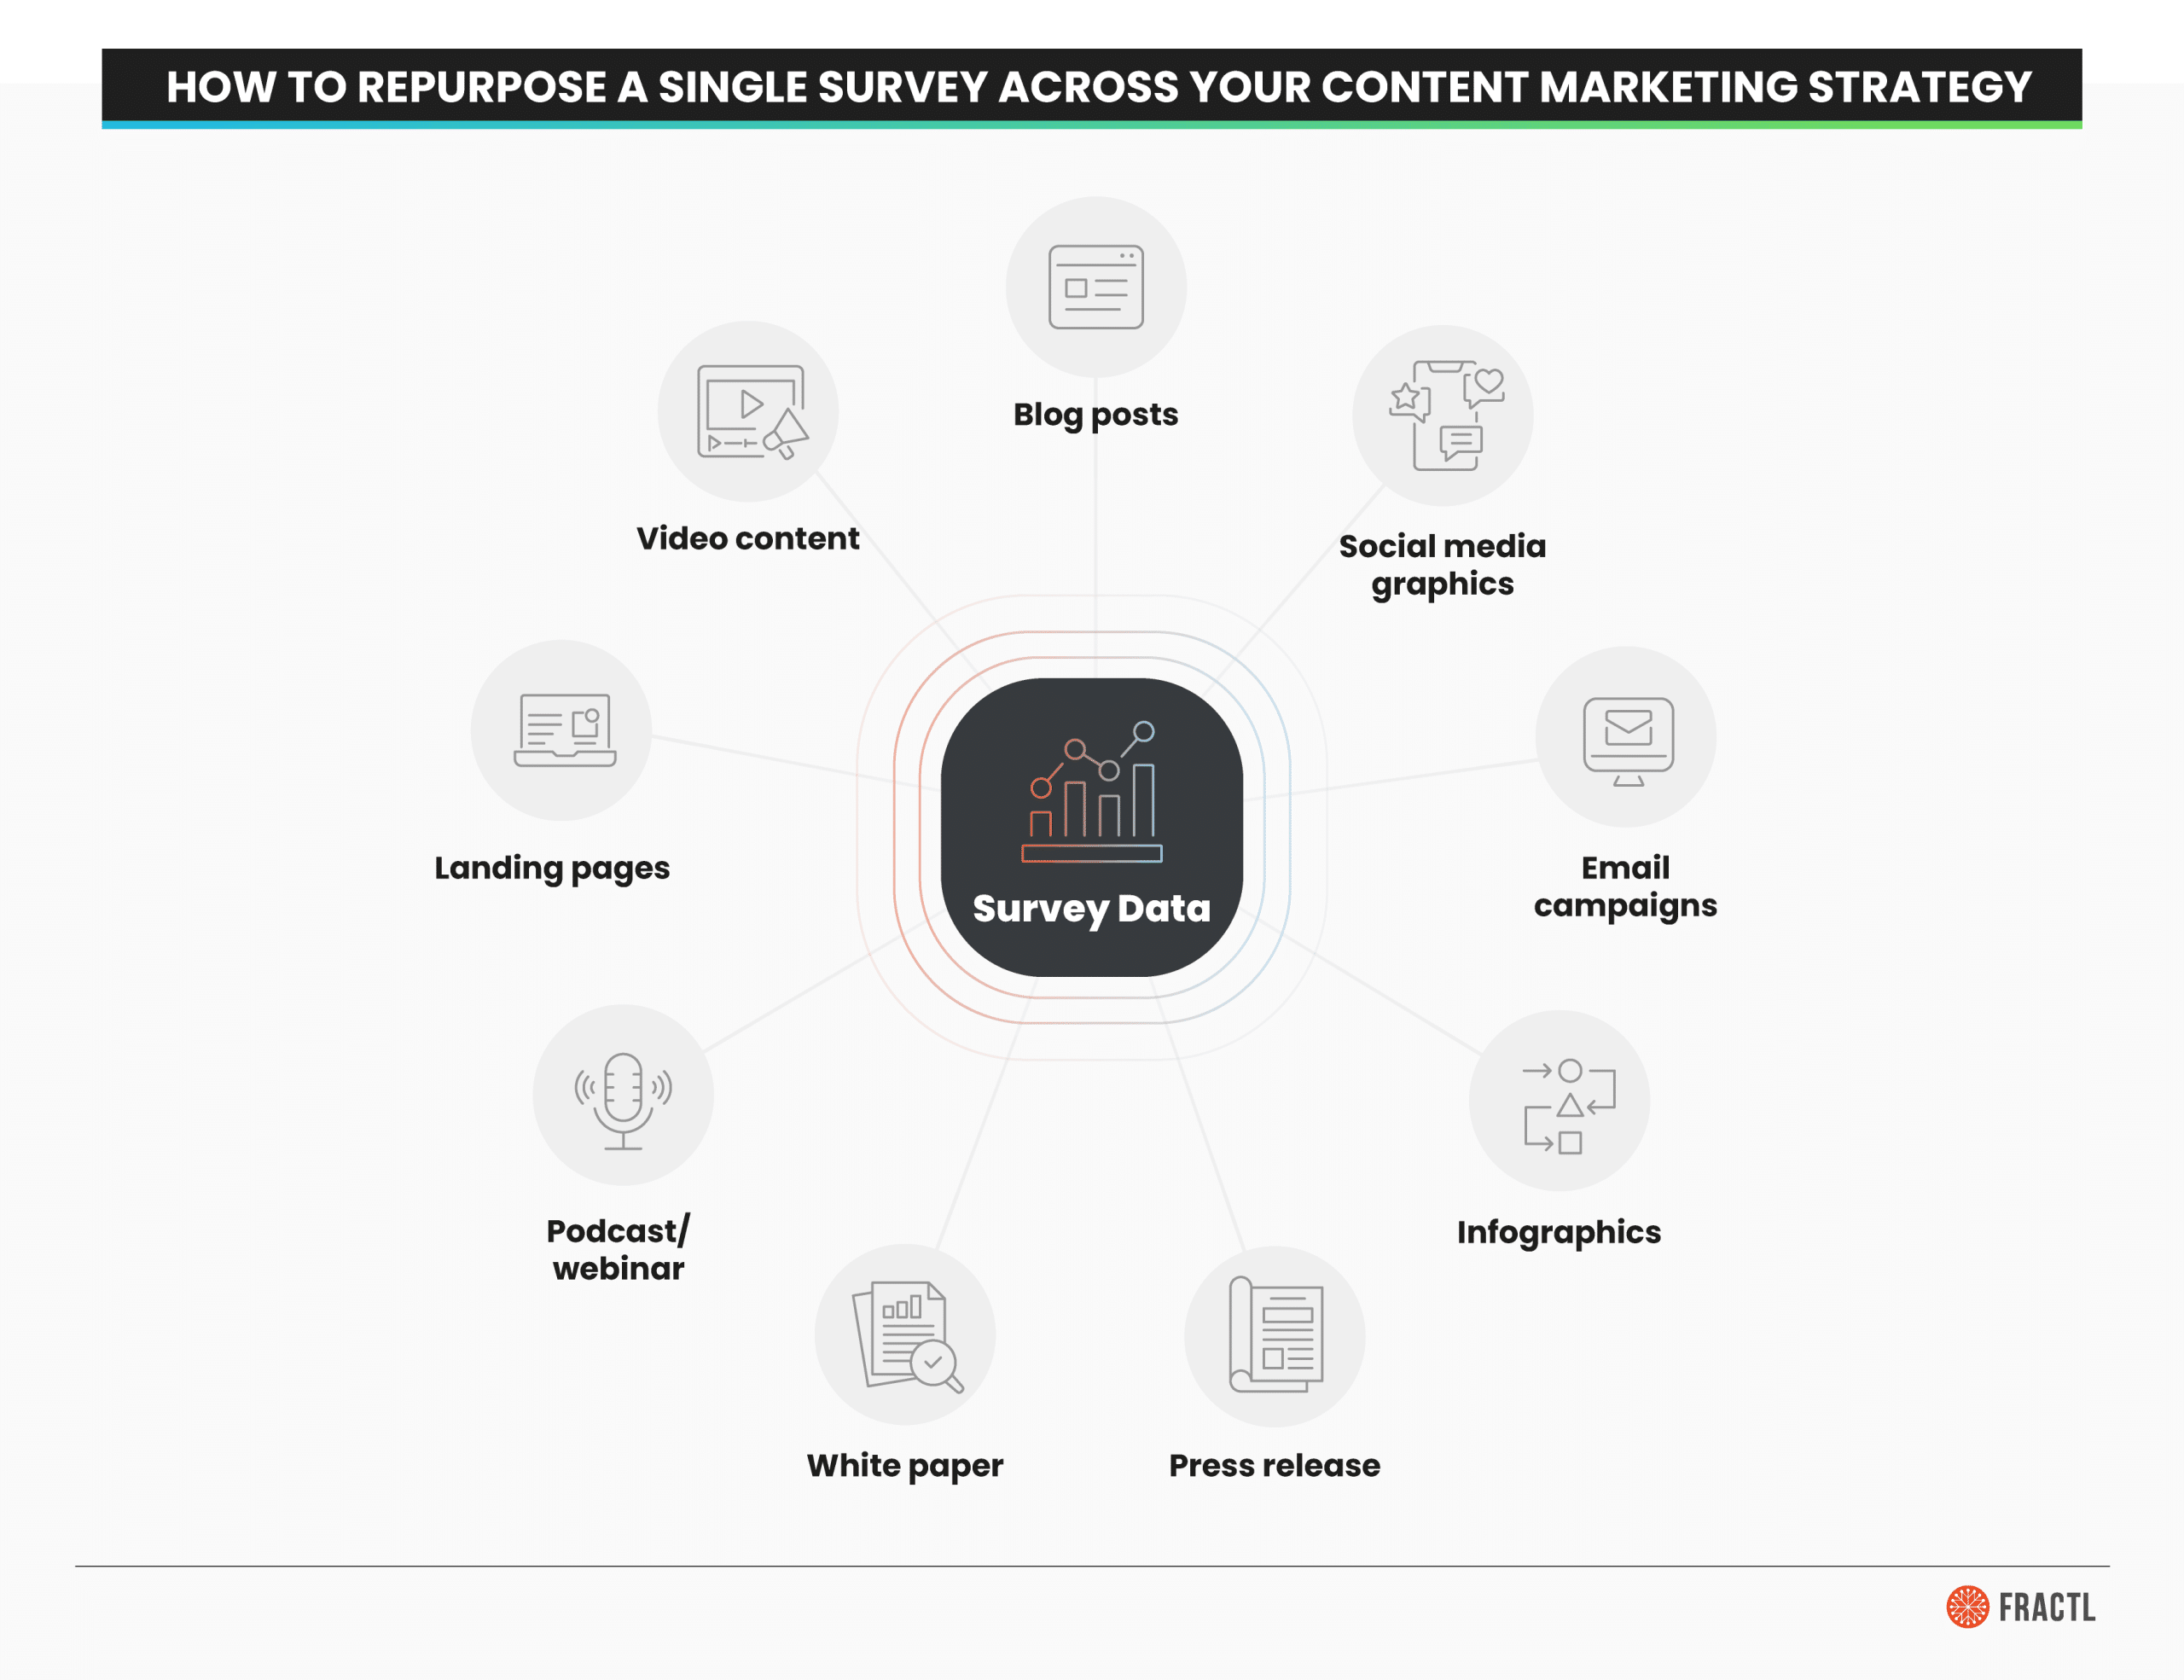
Repurposing Survey Data Across Marketing Channels
A single well-designed survey can fuel your content calendar for months. Here’s how to repurpose survey data across the full digital marketing funnel:
- Blog content. Multiple articles exploring different findings or angles from the same dataset.
- Social media marketing. Individual stats formatted as shareable graphics for LinkedIn, TikTok, and other social media channels.
- Email marketing and email newsletters. Drip campaigns highlighting key findings relevant to different buyer persona segments along the buyer’s journey.
- Podcasts and webinars. Discussion-format content where you break down findings with expert commentary.
- White papers and case studies. In-depth analysis for bottom-of-funnel potential customers evaluating your brand.
- Landing pages. Dedicated pages targeting specific search engine queries related to your survey topic.
- Infographics. Visual summaries optimized for social sharing, backlink acquisition, and search engine image results.
This is where the return on investment of survey-based content marketing compounds. One research project, dozens of content types, months of distribution across every marketing channel that matters. It’s a cost-effective approach that drives traffic, builds brand awareness, and creates measurable results well beyond the initial campaign.
Survey Credibility Checklist
Before you launch your next survey or pitch survey data to journalists, run through this checklist:
Design
- Topic alignment: Does the survey topic align with both journalist interest and your target audience’s search intent?
- Sample size:
- Have you calculated the minimum sample size for your desired confidence level and margin of error?
- Are you aiming for 1,000+ respondents?
- Question neutrality: Have multiple people reviewed the survey for leading questions, loaded language, and unbalanced response options?
- Question structure:
- Is the survey four to six minutes long?
- Are questions ordered from general to specific?
- Are attention checks included?
- Panel quality:
- Are respondents sourced from a reputable research panel?
- If using your own audience, have you accounted for self-selection bias?
Analysis
- Statistical testing:
- Have you tested key findings for statistical significance (p < 0.05)?
- Are confidence intervals reported?
- Subgroup validity: Do all reported subgroup cross-tabulations have at least 100 respondents per cell?
- Methodology section: Does your published methodology include sample size, dates, platform, sourcing, confidence level, margin of error, and weighting?
Distribution
- Content packaging: Have you created journalist-ready assets: landing page, visualizations, press release, and social content?
- Pitch personalization: Are you tailoring the pitch angle to each journalist’s beat using specific data points from the survey?
Build Trust Through Better Research
The difference between a content marketing survey that earns coverage and one that gets ignored isn’t the topic. It’s the rigor behind the data.
Journalists are inundated with pitches backed by survey data. Most of that data is undersampled, poorly designed, and presented without any evidence of statistical testing. That’s your opportunity. By investing in credible methodology (the right sample size, neutral questions, significance testing, and transparent reporting), you’re building something most brands don’t have: a reputation as a trustworthy data source.
That reputation compounds.
Journalists who cover your first campaign are more likely to cover the next one. Editors who verify your methodology once start trusting it by default.
Over time, your brand becomes a go-to source for original data in your vertical, which is exactly where effective content marketing and a strong earned media strategy converge. It’s cost-effective, it builds trust with both journalists and potential customers, and it creates valuable content that drives brand awareness long after the initial campaign ends.
If you’re ready to build survey-based campaigns with the methodology rigor that earns journalist trust and high-authority coverage, let’s talk.
Frequently Asked Questions
What is earned media?
Earned media is publicity you gain through organic, unpaid means: press coverage, social media mentions, word-of-mouth, reviews, and influencer endorsements. Unlike paid or owned media, it comes from independent third parties. That independence is what makes it credible, and why it drives trust, backlinks, and brand awareness.
What is content marketing?
Content marketing is a strategy focused on creating valuable, relevant content to attract and retain an audience. Instead of direct promotion, it educates and builds relationships at every stage of the buyer’s journey. Blog posts, videos, infographics, and case studies are common formats, all aimed at solving problems for your audience.
How many survey responses do I need for credible results?
At minimum, 384 responses give you ±5% margin of error at 95% confidence, which is the statistical floor for publishable data. For content marketing surveys designed to earn media coverage and support cross-tabulation analysis, aim for 1,000+ respondents. That threshold produces approximately ±3% margin of error at 95% confidence and gives you enough data in demographic subgroups to report meaningful differences. Response rates vary by survey platform and distribution method, so plan your respondent sourcing accordingly.
What are some examples of earned media?
Here are the most common forms of earned media:
- Media coverage. Journalists writing about your brand, data, or campaigns in news publications.
- Social media shares and mentions. Users organically sharing your content across social media channels.
- Positive customer reviews. Unpaid reviews on review sites, Google, or industry platforms.
- Influencer endorsements. Influencers mentioning your brand without sponsored payment.
- Guest podcast appearances. Being invited to discuss your expertise on someone else’s podcast.
- Backlinks from authoritative sites. Other websites linking to your content as a resource, which improves your search engine rankings and conversions.
- User-generated content. Customers creating content about your brand (photos, videos, testimonials) on their own social media accounts.
- Word-of-mouth recommendations. People recommending your brand to others based on their experience.
Each represents third-party validation that paid advertising can’t replicate, which is why earned media is one of the most cost-effective forms of digital marketing for building lasting brand awareness.