
Marketers are constantly working to better understand viral growth through content.
Luckily, a 2009 educational post by David Skok at ForEntrepreneurs.com may provide some insight on how to quantify it once it does happen. That post applies an equation for viral growth to predict things like the growth of the user base of a smartphone app and also points out the importance of sharing/invites from current customers to potential customers.
But in the age of social media, how do we account for tweets, pins, posts, and shares? We’ve adjusted David Skok’s equation to allow for social media-type sharing to visualize the profound impact this type of sharing plays in the spread of content online. This adaptation can help content marketers get a full appreciation for the staggering impact sharing has on the total views their content gets.
[Tweet “If only a small percentage of viewers share something, its viewership can still balloon as a result of that sharing.”]
Spurring Viral Growth
The phrase “viral” describes things that grow in a way that resembles the growth of a virus. A virus infects a host cell and replicates before breaking out of the host cell. Each replicated virus has the potential to infect another cell, where the process repeats. Not all replicated viruses will infect a new cell, but as long as more than one does on average, the number of infected cells will continue to climb.
Let’s liken this to the spread of online content. Not all shares will result in a new viewer, but as long as more than one new viewer is brought about on average through the sharing of a previous viewer, the number of people who have seen that content will increase.
The number of new viewers brought in by each existing viewer can be quantified using the viral coefficient, denoted with the letter k. For example, when k = 2, the number of view counts keeps rising as each viewer brings in two additional viewers, who each bring in two additional viewers, and so on.
Growth of this type (k > 1) is technically what the word “viral” means, but in reality, this type of growth is very rarely achieved and even more rarely sustained for more than a day at most. The word is now often understood to mean that the viewership of a piece of content rapidly ballooned as a result of sharing.
A more realistic type of growth is when k < 1, and while technically “not viral,” modeling such growth will help us account for the role of social shares that may bring in more than 90% of the viewership for a given piece of content. Suppose every eight viewers, on average, bring in four new viewers (i.e., k = .5). The first group of eight viewers will bring in four viewers in the next cycle, who will bring in two in the next.
And so for k < 1 type growth, the total number of people who have viewed the article grows but at a lesser and lesser rate in each cycle, and viewership growth eventually comes to a stop.
Adjusting the For Entrepreneurs Equation
Content is most commonly shared online on social networks like Facebook and Twitter and not by inviting specific users directly, as is the case in the For Entrepreneurs post. Social networks cast a much larger net than such direct sharing, but content shared on social networks is less relevant to those it’s visible to than direct sharing. Essentially, we need to adjust the For Entrepreneurs equation to account for social sharing.
The “For Entrepreneurs” post defines the number of new customers brought in by each existing customer as k = i * c, where i is the number of invites sent out, and c is the likelihood the invitees are to become customers. But in the context of social sharing, we need to consider the fact that a Facebook post is different from a direct invite to a friend or colleague.
To do this, we need to consider:
-
The likelihood that the content will be shared
-
The size of the audience shared with
-
The portion of that audience that actually views the content
To allow for these three factors, we’ll define k = i * p * c, where i is the average number of shares for each viewer of the article, p is the average number of people that share is visible to, and c (conversion rate) is the percentage of those who see the share who actually view the content.
Initial Customers vs. Viewership Growth
We’ll also tweak the idea of an initial customer base (v0) outlined in David’s post. In our context, v0 is understood to mean the initial viewership (i.e., the views that do not come from sharing). Rather than assuming all initial viewers are already there at the start of our model as the For Entrepreneurs model does, we will allow for the fact that viewership grows with time as viewers stream in organically from a homepage or sidebar, and thus change v0 to v0(t) to reflect its time dependence.
v0(t) must reflect how when content first appears on a homepage, people are much more likely to click through to the article than they are after it’s been there for a day and has been pushed out by newer content. General math knowledge has led us to approximate this behavior using the following equation, where vi is the total number of views that don’t come from sharing. As time increases, v0(t) approaches vi , and the speed at which it does that depends on how the particular site features content on its homepage or sidebar. A plot of v0(t) for various values of b is shown below.
The Equation
For the sake of time, we’ve skipped the derivation, but here’s the result:
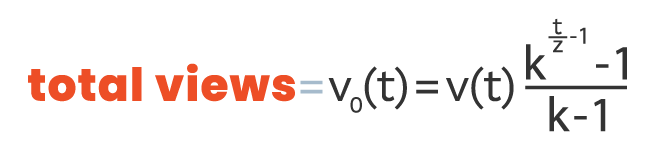
The Variables
- t – time (days).
- z – viral cycle time (days). This is the amount of time it takes between someone viewing the article and sharing it and others checking it out as a result of that share. Reasonable estimate z = .25 days.
- k – viral coefficient (new viewers per viewer). The number of new viewers brought in due to the sharing of each viewer.
- k = i*p*c
- i – shares per viewer.
Reasonable Estimates
i – shares per viewer.
Reasonable estimate i = 5% = .05 (one out of 20)
p – prospective shared audience (potential viewers), aka the number of people who see a given tweet or Facebook share.
Reasonable estimate p = 100
c – conversion rate (views per share). Percentage of p that actually view the tweeted/shared article.
Reasonable estimate c = 15% = .15
Therefore, a reasonable estimate is k = .05 x 100 x .15 = .75
Hopefully, the simulation above demonstrated the main takeaway of this article – the importance of the viral coefficient in determining the number of views content gets.
One thing you may have noticed is that for k < 1, k is a direct indicator of where views come from. If k = .1, then 10% of the content’s views will come from sharing. If k = .83 then 83% of the content’s views will come from sharing.
k doesn’t even have to be greater than 1 for amazing things to happen. In addition, if only a small percentage of viewers actually share something, its viewership can still balloon as a result of that sharing.
How to Increase the Power of k
k = i * p * c
Maximize all three:
i – shares per viewer
How can you increase the likelihood that someone will share an article upon viewing it?
Motivate sharing. It comes down to the content itself and the ease of sharing. Examples on how to improve this:
-
Integrate sharing buttons as part of the user experience and make them obvious, but not spammy.
-
Create built-in tweets readers can use when clicking the Twitter share button. Avoid tweets that sound like any form of marketing, and try to incorporate a small amount of knowledge to be gained from the content in question – just enough to pique curiosity.
It mainly comes down to content, though. To create emotionally resonant content people are more likely to actually share, we encourage you to check out our VP of Creative Kristin Tynski’s post here.
p – prospective shared audience (number of people who actually see a given share)
How can you increase the number of people that shares of your content are visible to on social networks?
This is the most difficult variable to influence. It’s sometimes possible to reach out to people with an impressive base of fans/followers to get them to share. You can also gear content toward certain types of audiences that are more engaged on social networks (e.g., ages 15–23 or techies).
c – conversion rate
How can you encourage people to actually check out the content they see posted on social media?
Set up enticing scheduled tweets, making sure they’re not spammy. Consider the theories behind headlines and subject lines, as they’re relevant here. If the tweet is unappealing and generic, then your content will be largely overlooked, but if it successfully entices readers to view the content, then your viral coefficient can rise dramatically.
A large part of getting people to check out the content is simply the relevance and/or timely nature of it, and piggybacking your content off subjects that are already trending is a great way to encourage people to actually click a link they see on social media. Does your content shed new light on already trending topics?
Conclusion
The viral coefficient allows us to predict where views of a given piece of content are coming from and helps us understand the profound impact of the socially enabled web. The “For Entrepreneurs” post was written in 2009 before social media was leveraged to spread content in the way it is today.
While the direct sharing the For Entrepreneurs post looks at is still relevant and boasts extremely high conversion rates, content that is shared on social networks has a much higher shared audience. Accounting for this development and adapting the “For Entrepreneurs” post’s theory demonstrates how past concepts can still be applied and made applicable to new online trends.
Hello, I found the information provided by this article very interesting. So much that I have decided to research it more. However, in order to do this, it would be extremely helpful if the derivation of the formula would be given. Please try to help, Thank You.